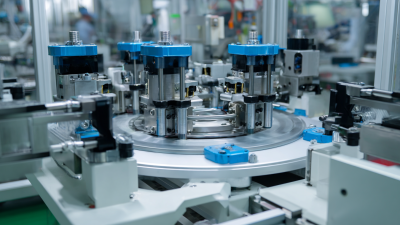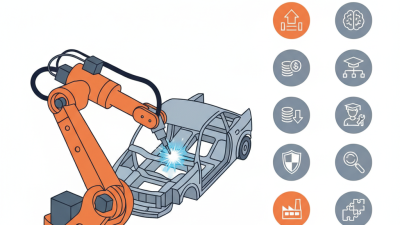

Choosing the right automation machine in 2026 requires more than comparing prices and production speeds. Global buyers must examine product quality, labor conditions, energy use, maintenance access, software compatibility, and local technical support. A robotic palletizer may suit a high-volume warehouse, while a collaborative robot may fit a smaller assembly line with frequent product changes. The best choice depends on the workpiece, cycle time, factory layout, and operator skills.
Joseph F. Engelberger, widely recognized as the father of industrial robotics, said, “I can’t define a robot, but I know one when I see one.” His observation remains relevant because modern automation is no longer limited to large robotic arms. Today’s automation machine market includes CNC systems, vision inspection equipment, packaging machines, automated guided vehicles, filling lines, and flexible assembly cells. Each type solves a different operational problem.
Real purchasing decisions often reveal uncomfortable details. A fast machine can become expensive when spare parts take eight weeks to arrive. A compact system may also require costly software upgrades. Some buyers focus too heavily on impressive specifications. They overlook training, safety integration, cleaning time, and long-term reliability. This guide examines the leading automation machine types for global buyers in 2026, using practical criteria rather than marketing claims. It also considers regional standards, installation risks, and return-on-investment expectations. No machine is perfect. Careful evaluation still prevents many avoidable mistakes.
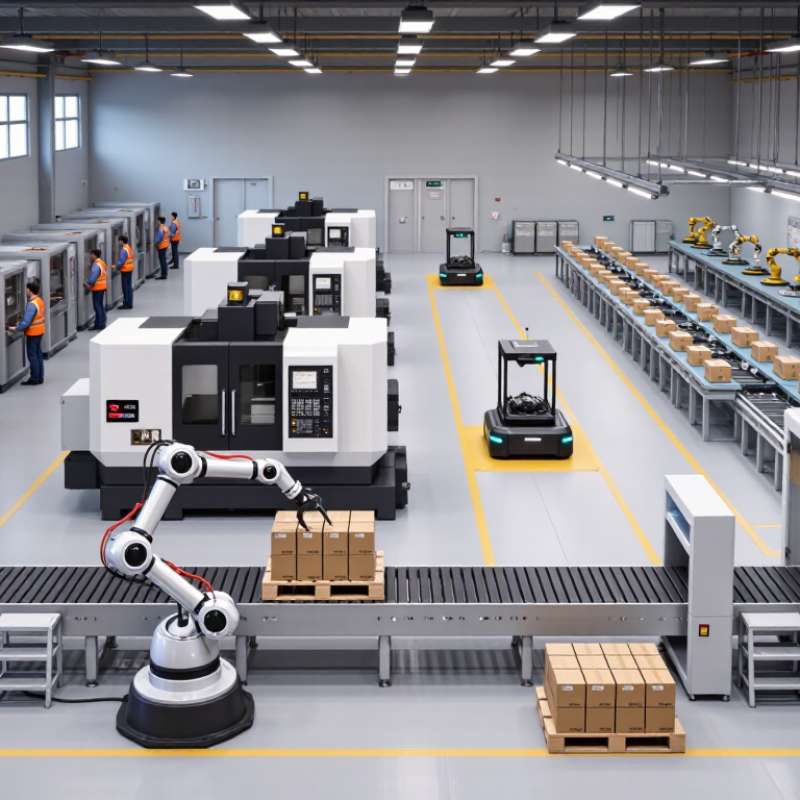
The International Federation of Robotics reported 542,000 industrial robots installed worldwide in 2024. This figure signals continued demand for flexible production equipment. Global buyers are reviewing robotic arms, automated guided vehicles, vision inspection systems, and CNC automation cells. Each machine type solves a different production problem. Robotic arms suit welding, assembly, palletizing, and repetitive handling. Vision systems check labels, dimensions, and surface defects at production speed. Mobile robots can move components across warehouses with fewer manual transfers.
Tips: Match the machine to your process, not the sales brochure. Check payload, cycle time, floor space, software compatibility, and operator training needs. Ask for documented test results using your actual materials. A factory trial is often more useful than a polished demonstration. Local service coverage also matters when a sensor fails during a night shift.
The 542,000-unit figure does not mean every factory needs a robot. Some operations still benefit from conveyors, indexing tables, or semi-automatic fixtures. Over-automation can increase maintenance costs and create new bottlenecks. Buyers should measure labor time, defect rates, changeover delays, and safety requirements before choosing equipment. My practical concern is integration quality. A fast machine connected to weak data systems may produce faster confusion. Careful commissioning, staff feedback, and staged upgrades remain sensible choices for 2026.
In 2026, global buyers should compare robotic arms and cobots by payload, cycle time, and workplace design. The choice is not simply about automation level.
The International Federation of Robotics reported 541,302 industrial robots installed worldwide in 2023. Its World Robotics 2024 report also recorded 4.28 million robots operating globally. These figures support conventional robotic arms for repetitive, high-speed production. A six-axis arm can move heavy parts, weld continuously, or load a press inside a guarded cell. It usually delivers higher payload and faster cycles.
Cobots suit smaller batches, frequent changeovers, and shared work areas. They can support inspection, light assembly, screwdriving, or carton handling beside trained operators. However, lower speed and payload can reduce output. Interact Analysis reported continued double-digit growth in the collaborative robot market, but adoption still depends on application economics and safety assessment. Growth is not proof of universal suitability.
Payload calculations must include grippers, cables, and the product itself. A 10-kilogram part may require more capacity than expected. Reach matters too. A long arm can create slower motion and larger safety zones. Buyers should test the real task, including awkward angles and daily fatigue. The boundary is not clean. Some cobots need guarding, while some traditional arms can work in carefully engineered shared processes. A pilot cell often reveals problems that a spreadsheet misses.
| Evaluation Dimension | Industrial Robotic Arm | Collaborative Robot (Cobot) | Buyer Selection Guidance |
|---|---|---|---|
| Primary Design Objective | High throughput, repeatability, continuous-duty production, and integration with automated equipment. | Flexible deployment, human-machine cooperation, fast changeovers, and automation of variable tasks. | Choose an industrial arm for production capacity; choose a cobot for flexibility and frequent product changes. |
| Typical Payload Selection | Typical range Approximately 3–300 kg, depending on arm class, reach, wrist moment, and application tooling. |
Typical range Approximately 3–30 kg; some heavy-payload collaborative models exceed this range, subject to risk assessment and reduced operating conditions. |
Calculate payload as part + gripper + cables/hoses + a safety margin. Do not select by part weight alone. |
| Recommended Payload Margin | A practical engineering allowance is commonly 20–30% above the calculated payload, while checking the manufacturer’s wrist-moment and inertia limits. | A practical allowance of approximately 20–30% is advisable, with additional attention to collision forces, tool mass, and center-of-gravity limits. | For long tools, offset centers of gravity, or high acceleration, select the next payload class rather than operating at the nominal limit. |
| Reach and Workspace | Common working reaches are approximately 0.5–3.0 m, with specialized models available outside this range. | Common working reaches are approximately 0.5–1.8 m, with selected models offering longer reach. | Confirm reach at the required wrist orientation, not only the advertised maximum radius. |
| Repeatability | Typically about ±0.02–0.10 mm for many articulated industrial robots; the actual value depends on robot class and reach. | Typically about ±0.02–0.10 mm for many collaborative robot models; application accuracy can be affected by compliance, tool deflection, and load. | For tight assembly or machine tending, validate absolute accuracy, repeatability, and fixture accuracy together. |
| Cycle-Time Capability | Best suited to high-speed handling, welding, palletizing, packaging, and machining support in dedicated cells. | Best suited to moderate-speed assembly, inspection, dispensing, screwdriving, machine tending, and ergonomic assistance. | Use an industrial arm when takt time is the main constraint; use a cobot when operator access and product mix are more important. |
| Human Collaboration | Normally installed inside a safeguarded cell using fencing, interlocked gates, scanners, mats, or other protective measures. | Designed for potential collaborative operation, but contact operation still requires application-specific risk assessment and validated safety functions. | “Collaborative” does not mean inherently safe for every tool, payload, speed, or workpiece. |
| Safety and Compliance | Industrial robot installations should be designed in accordance with applicable machinery, robot, electrical, and functional-safety requirements. | Collaborative applications should be assessed using applicable requirements, including ISO 10218 and ISO/TS 15066 where relevant. | The integrator should document hazards, operating modes, stopping performance, pinch points, sharp edges, and foreseeable misuse. |
| Programming and Deployment | Usually requires trained robot programmers and more detailed cell, PLC, fixture, and safety integration. | Often provides hand-guiding, graphical programming, and quicker setup for small and medium production batches. | Estimate total deployment time, including gripper design, vision, PLC communication, safety validation, and operator training. |
| Floor Space and Infrastructure | Usually requires a dedicated cell, safety hardware, robust foundations or stands, and controlled material flow. | Can often be mounted on a compact stand or mobile platform, although guarding or separation may still be required. | Compare the complete footprint, including fixtures, pallets, safety zones, maintenance access, and operator movement. |
| Environmental Suitability | Broad selection for dust, moisture, washdown, paint, welding, cleanroom, high-temperature, and other specialized environments. | Suitable versions exist for selected cleanroom, food, dust, and washdown applications, but environmental ratings vary by model. | Verify IP rating, corrosion resistance, temperature range, cleanroom classification, and hygienic design before purchase. |
| Tooling and Process Loads | Well suited to heavy grippers, welding guns, palletizing forks, rotary tools, and high-inertia end effectors. | Well suited to lightweight grippers, cameras, screwdrivers, dispensers, small vacuum tools, and modular end effectors. | Check wrist torque, static moment, dynamic inertia, cable routing, and pneumatic or electrical utility requirements. |
| Changeover and Product Mix | Strong performance in standardized, high-volume production; changeovers may require more engineering and cell reconfiguration. | Strong fit for mixed-model production, frequent changeovers, pilot lines, and multi-purpose workstations. | For multiple SKUs, evaluate recipe management, vision guidance, quick-change tooling, and operator usability. |
| Integration Complexity | Typically higher due to guarding, safety PLCs, conveyors, fixtures, sensors, and production-line synchronization. | Often lower for standalone tasks, but complexity can rise when integrating vision, force control, conveyors, and collaborative safety. | Compare the total system cost rather than the robot purchase price alone. |
| Best-Fit Applications | Automotive and component handling, palletizing, welding, painting, high-speed packaging, machining, and heavy assembly. | Light assembly, inspection, screwdriving, dispensing, laboratory handling, machine tending, packaging, and ergonomic assistance. | Match the robot type to payload, cycle time, risk profile, changeover frequency, and required production uptime. |
| IFR Market Context | Industrial robot installations reached approximately 541,000 units worldwide in 2023, according to the International Federation of Robotics. | Cobots are included within the broader industrial robot market; publicly reported global totals should be interpreted according to each report’s definition and coverage. | Use IFR data for market context, then validate current regional availability, service capability, standards, and application performance. |
| Overall Buyer Recommendation | Best choice when: high output, heavy payload, demanding takt time, long duty cycles, or specialized environments are required. | Best choice when: flexible deployment, operator proximity, small batches, frequent changeovers, or rapid programming are priorities. | Final decision: select by payload and wrist moment first, then verify reach, cycle time, safety, tooling, integration cost, and service support. |
For global buyers, CNC machines and flexible automation cells should be judged through measurable performance, not impressive brochures. NIST measurement principles support traceable testing, consistent definitions, and repeatable records. In practice, buyers can check positional accuracy with calibrated tools and test coupons. Repeatability matters too. A machine may hit one coordinate perfectly, then drift after six hours of cutting.
Accuracy data should include temperature, material, tool wear, and operator changes. These details expose hidden variation. A 0.02 mm deviation may be acceptable for structural parts but costly for precision assemblies. Record the result at startup, mid-shift, and after thermal changes. The process becomes visible. Still, no factory measurement is perfect. Sensors need calibration, and test conditions may not match daily production.
Uptime requires more than a running light. Track planned production time, stoppage minutes, changeover duration, and recovery speed. Flexible cells should also report how quickly they switch between part families. A practical ROI model combines output value, labor savings, scrap reduction, maintenance costs, and installation expenses. Payback should use real production data, not optimistic capacity claims. Buyers can compare monthly results against the baseline line. Sometimes the new cell reduces labor but increases programming effort. That weakness deserves attention. A reliable decision includes both gains and friction.
| Metric | CNC Machining Center | Flexible Manufacturing Cell |
|---|---|---|
| Typical positioning accuracy | 10 µm | 15 µm |
| Operational availability | 85% | 80% |
| Simple payback period | 2.5 years | 3.5 years |
The chart converts the operational figures into a comparable performance index, where 100 represents the reference target. Accuracy is scored against a 10 µm target, availability is shown against a 100% target, and payback is scored against a two-year target. These are indicative, vendor-neutral industrial benchmark values; actual results depend on process requirements, material, maintenance, utilization, and automation scope.
Packaging and assembly automation is shifting from simple speed targets toward measurable, repeatable performance. PMMI benchmark guidance often connects throughput with OEE, combining availability, performance, and quality. These figures help global buyers compare cartoners, case packers, filling systems, robotic cells, and inspection equipment.
A machine rated at 120 units per minute may produce less on a real production floor. Changeovers, material jams, operator checks, and short stops reduce effective output. Track hourly production, downtime reasons, scrap, and recovery time. A stable 85% OEE can be more valuable than an unstable 95% result. Our first baseline was wrong because minor stoppages were not recorded consistently. That mistake changed the purchasing discussion.
Tips: Request a witnessed factory test. Measure good units, not total cycles. Review three shifts of data. Check how quickly operators clear a jam. Ask for maintenance records and spare-parts lead times. Verify that controls support local safety requirements and available technical skills. Small details matter. A narrow conveyor may limit future products. A fast robot may still create a slow packing station. Benchmark results need context, and the context is often incomplete.
For global buyers, machine selection starts with verifiable safety evidence. The International Federation of Robotics reported 541,302 industrial robots installed worldwide in 2023. Its operational stock exceeded 4.28 million units. This scale increases the need for disciplined supplier checks.
Request conformity documents for ISO 10218-1:2025 and ISO 10218-2:2025, where applicable. Verify risk assessments, guarding, emergency stops, operating limits, and validation records. A certificate alone is not enough. Ask who tested the complete production cell. Confirm whether regional electrical and workplace requirements were included.
Total cost of ownership should cover integration, tooling, training, energy, software, spare parts, downtime, and disposal. The U.S. Department of Energy reports that motor-driven systems can exceed half of industrial electricity use in some facilities. Actual savings still depend on duty cycle. Build a five-year model using measured cycle time and local operating rates. Payback under 24 months sounds attractive. It can also be misleading. Test seasonal demand, rejected parts, maintenance delays, and a 20% cost variation. Service data often decides availability. Require mean time to repair, first-time fix rate, spare-part fill rate, response time, and local technician coverage. Request anonymized records from comparable installations. Marketing averages are weak evidence. Supplier data may be incomplete. Independent validation is worth the cost.
© 1999-2025 The Lincoln Electric Company